pacman::p_load(sf, tmap, tidyverse)In-Class Exercise 03
Chloropleth Mapping
NGA_wp <- read_rds("data/rds/NGA_wp.rds")Plotting map of rate
p1 <- tm_shape(NGA_wp) +
  tm_fill("wp_functional",
          n = 10,
          style = "equal",
          palette = "Blues") +
  tm_borders(lwd = 0.1,
             alpha = 1) +
  tm_layout(main.title = "Distribution of functional water points of LGAs",
legend.outside = FALSE)tmap_arrange(p1, nrow = 1)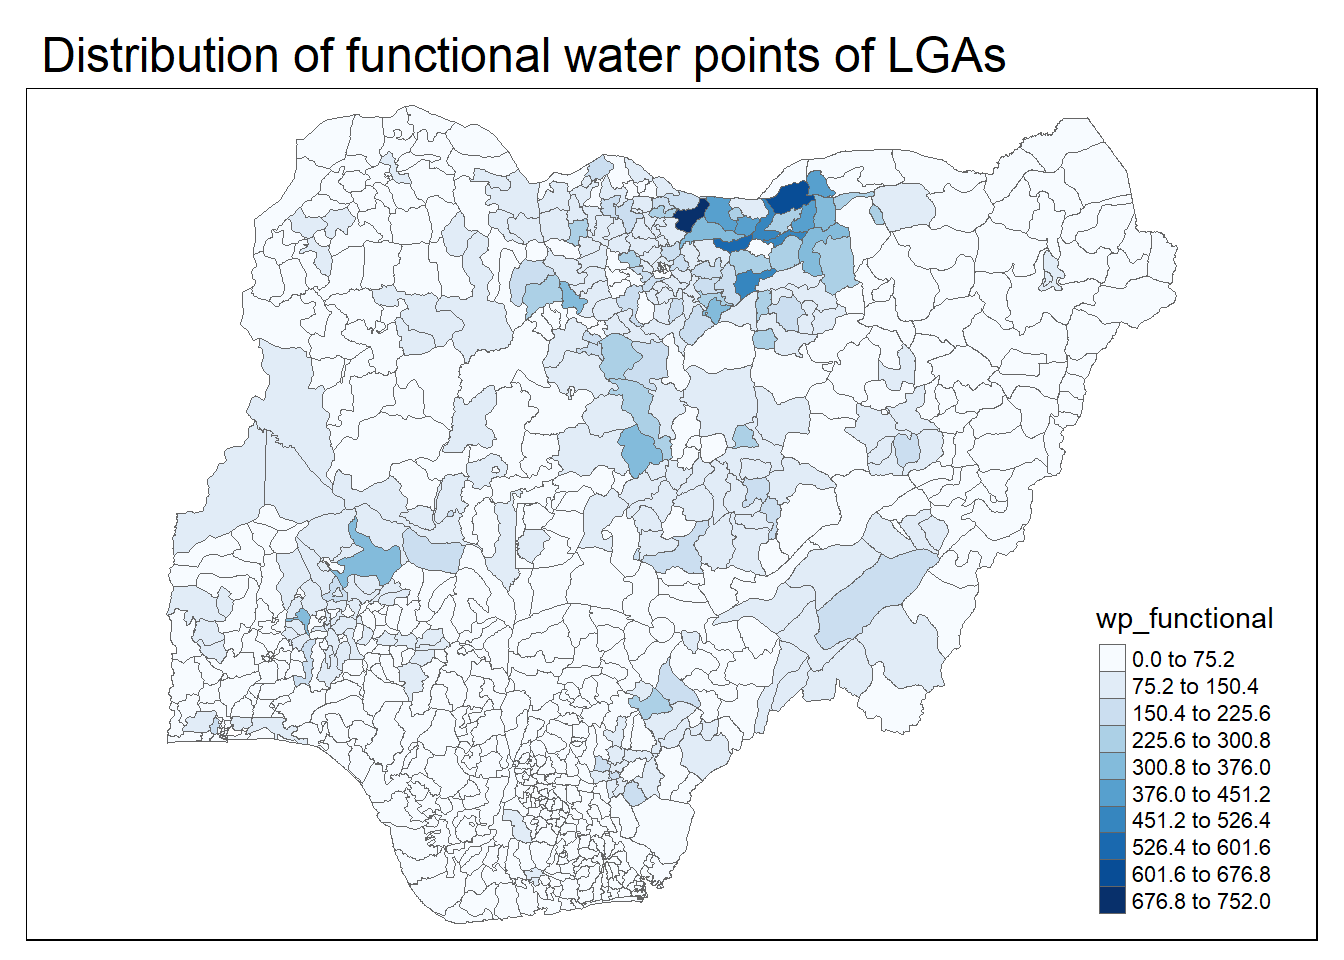
Rate map of functional water point by LGAs
NGA_wp <- NGA_wp %>%
  mutate(pct_functional = wp_functional/total_wp) %>%
mutate(pct_nonfunctional = wp_nonfunctional/total_wp)tm_shape(NGA_wp) +
tm_fill("pct_functional",
n = 10,
style = "equal",
palette = "Reds") +
tm_borders(lwd = 0.1,
alpha = 1) +
tm_layout(main.title = "Rate map of functional water points",
legend.outside = TRUE)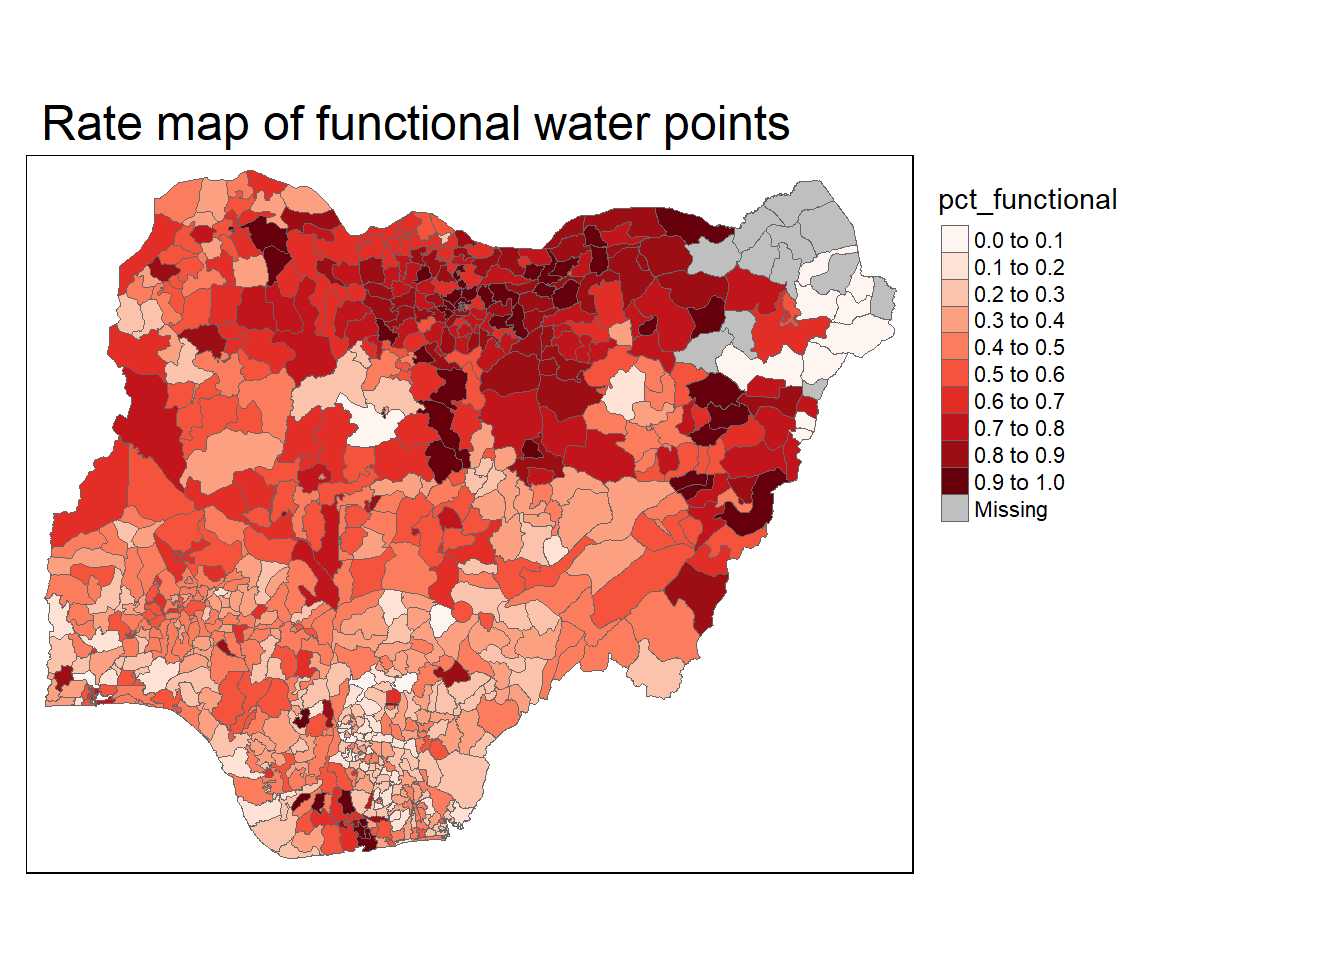
Extreme Value Map
Percentile Map
Exclude records with NA
NGA_wp <- NGA_wp %>%
  drop_na()
Creating customised classification and extracting values
#percent <- c(0,.01,.1,.5,.9,.99,1)
#var <- NGA_wp['pct_functional'] %>%
  #st_set_geometry(NULL)
#quantile(var[,1],percent)
get.var <- function (vname, df) {
v <- df[vname] %>%
st_set_geometry(NULL)
v <- unname (v[,1])
return(v)
}percentmap <- function(vnam, df, legtitle=NA, mtitle="Percentile Map"){
percent <- c(0,.01,.1,.5,.9,.99,1)
var <- get.var(vnam, df)
bperc <- quantile(var, percent)
tm_shape(df) +
tm_polygons() +
tm_shape(df) +
tm_fill(vnam,
title=legtitle,
breaks=bperc,
palette="Blues",
labels= c("< 1%", "1% - 10%", "10% - 50%", "50% - 90%", "90%", "90% - 99%", "> 99%"))
tm_borders() +
tm_layout(main.title = mtitle,
title.position = c("right", "bottom"))
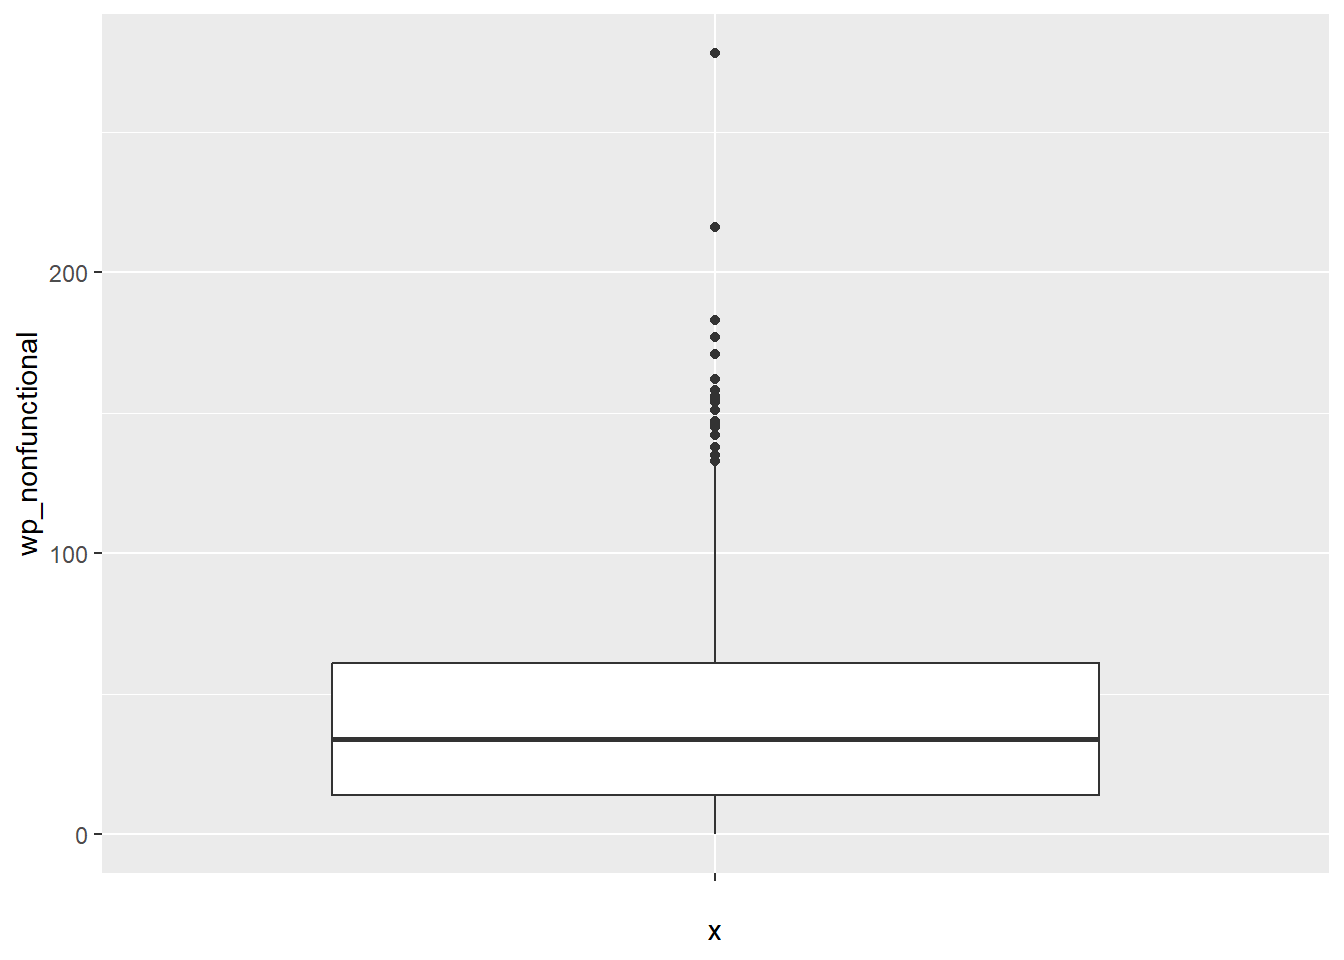
}#percentmap("wp_functional",NGA_wp)Box map
ggplot(data = NGA_wp,
       aes(x = "",
           y = wp_nonfunctional)) +
  geom_boxplot()